Culture & Cuisine

European Diet Map by Machine Learning

top of page

  • Tom Tran

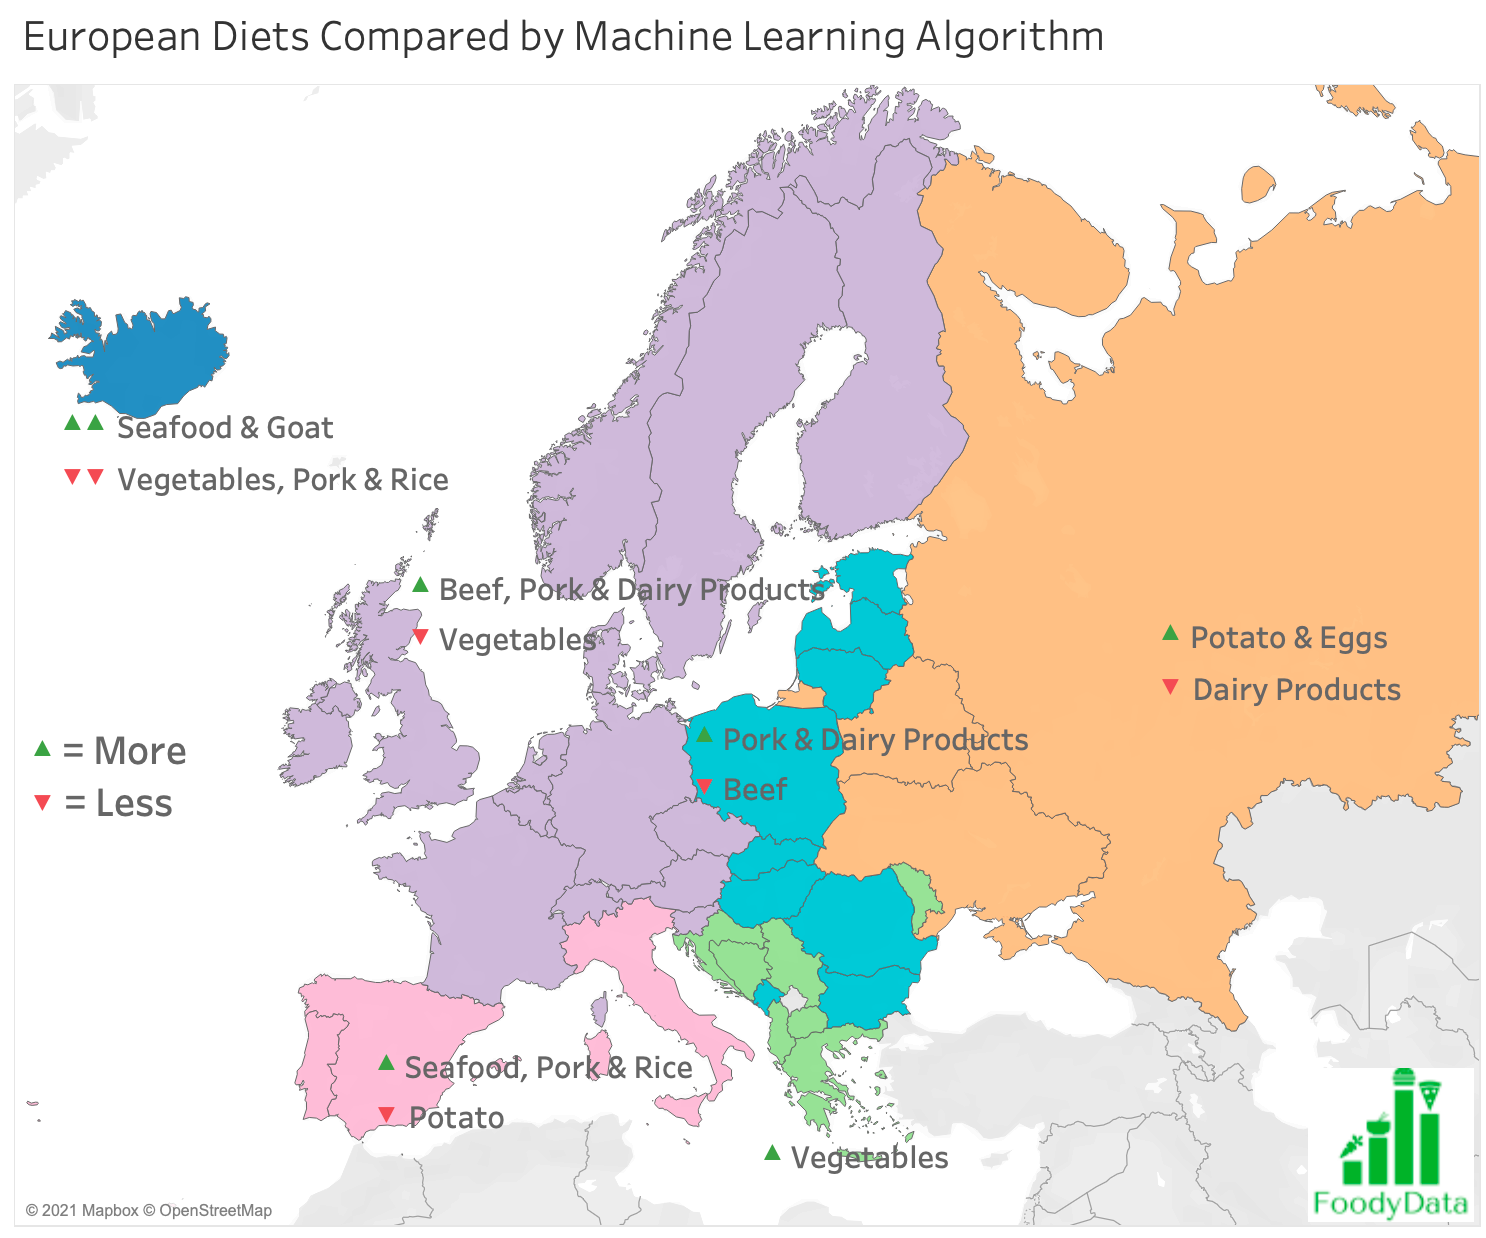
Europe Diet Map by Machine Learning Algorithm Based on Per Capita Consumption

Using clustering algorithm, I created this map based on per capita consumption data including vegetables, seafood, beef, pork, poultry, etc.
6e7e38_cad1405366704dcb87e62e9fd7855468mv2-5963290

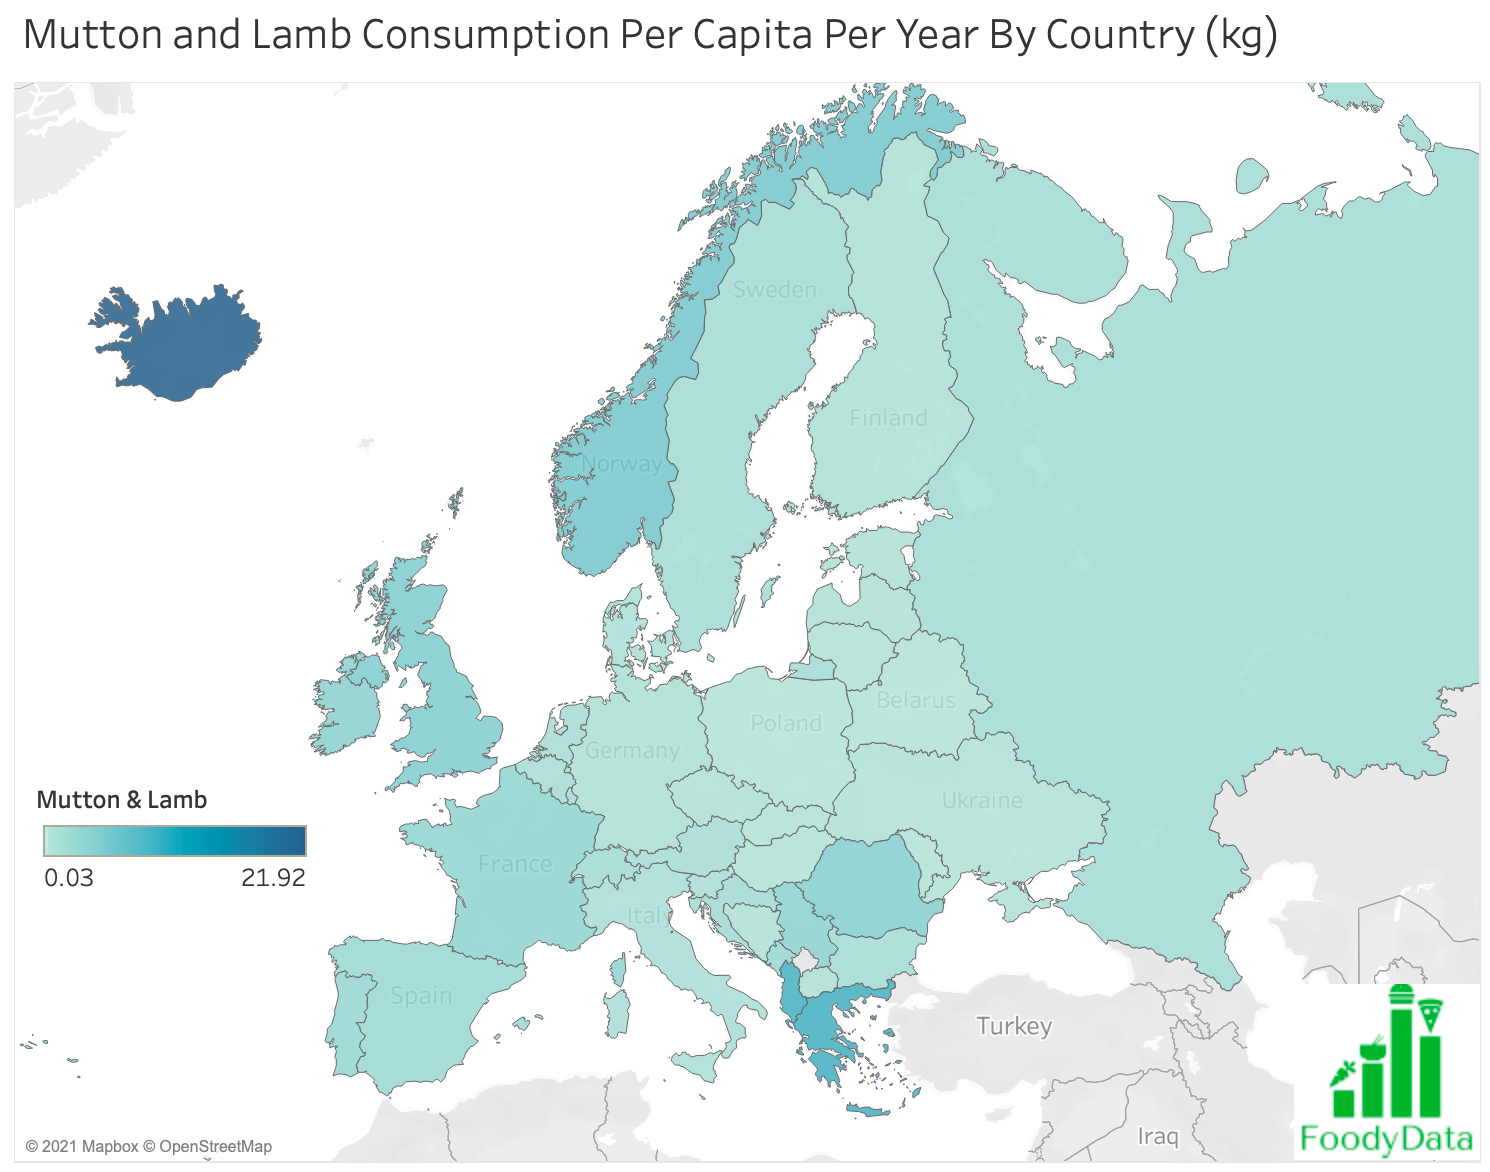
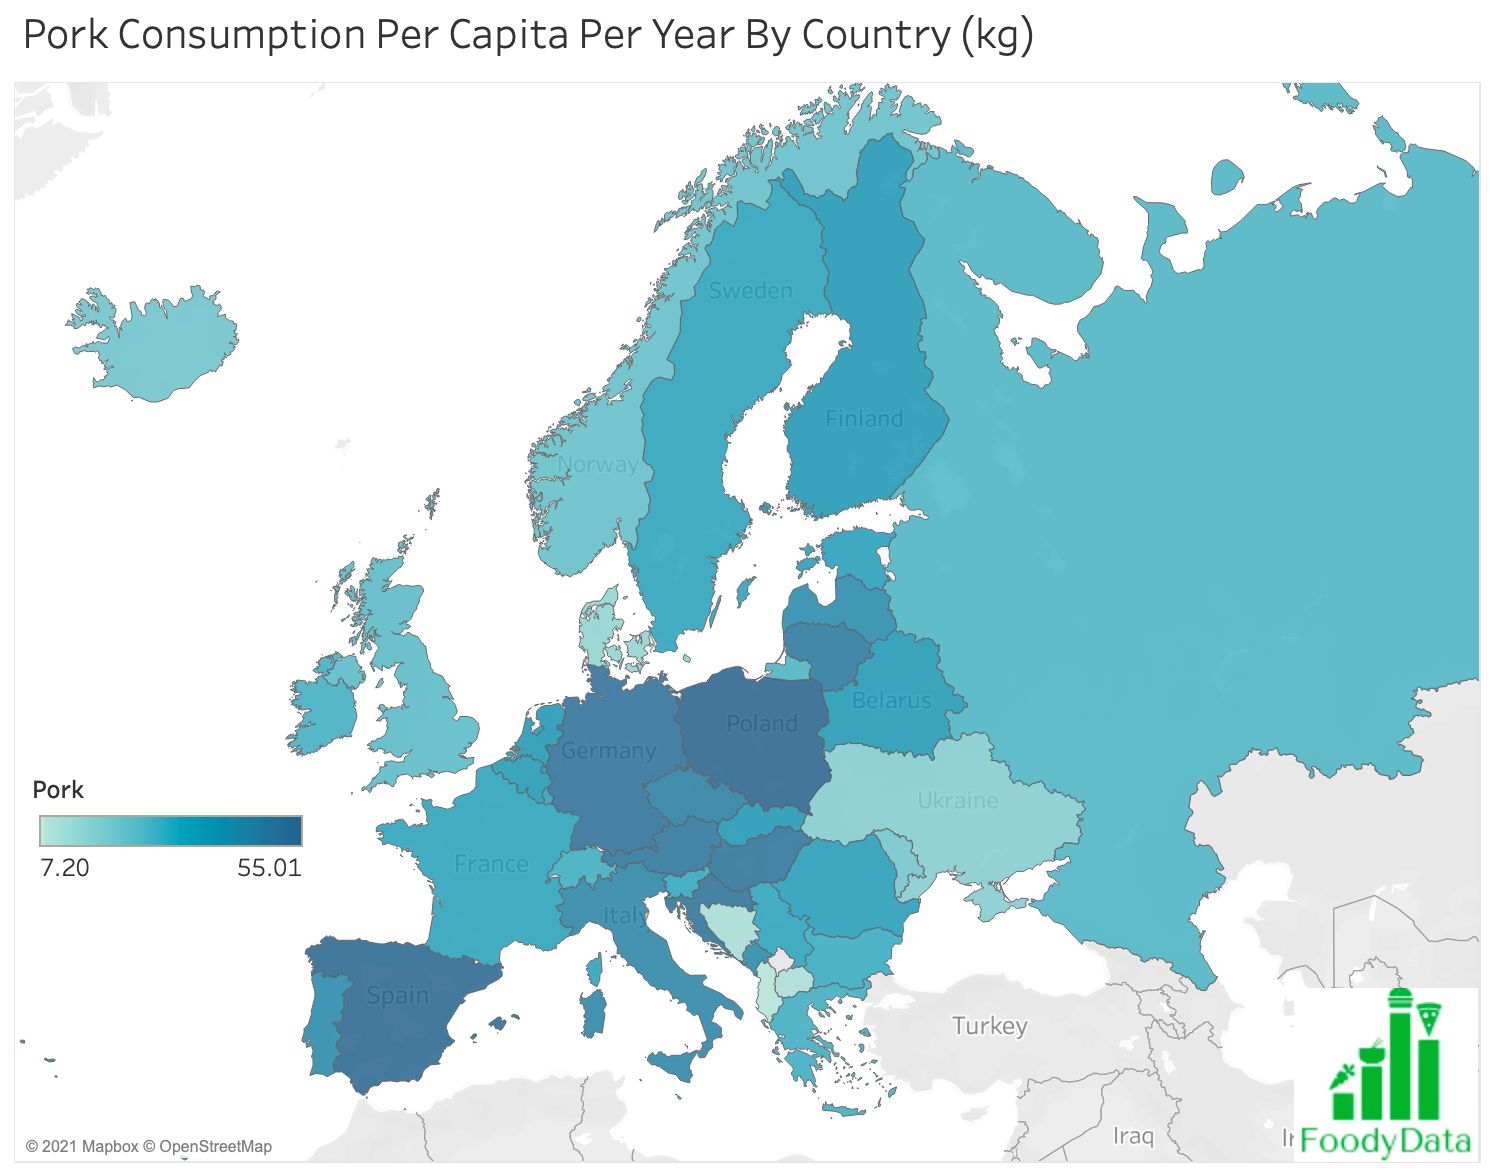
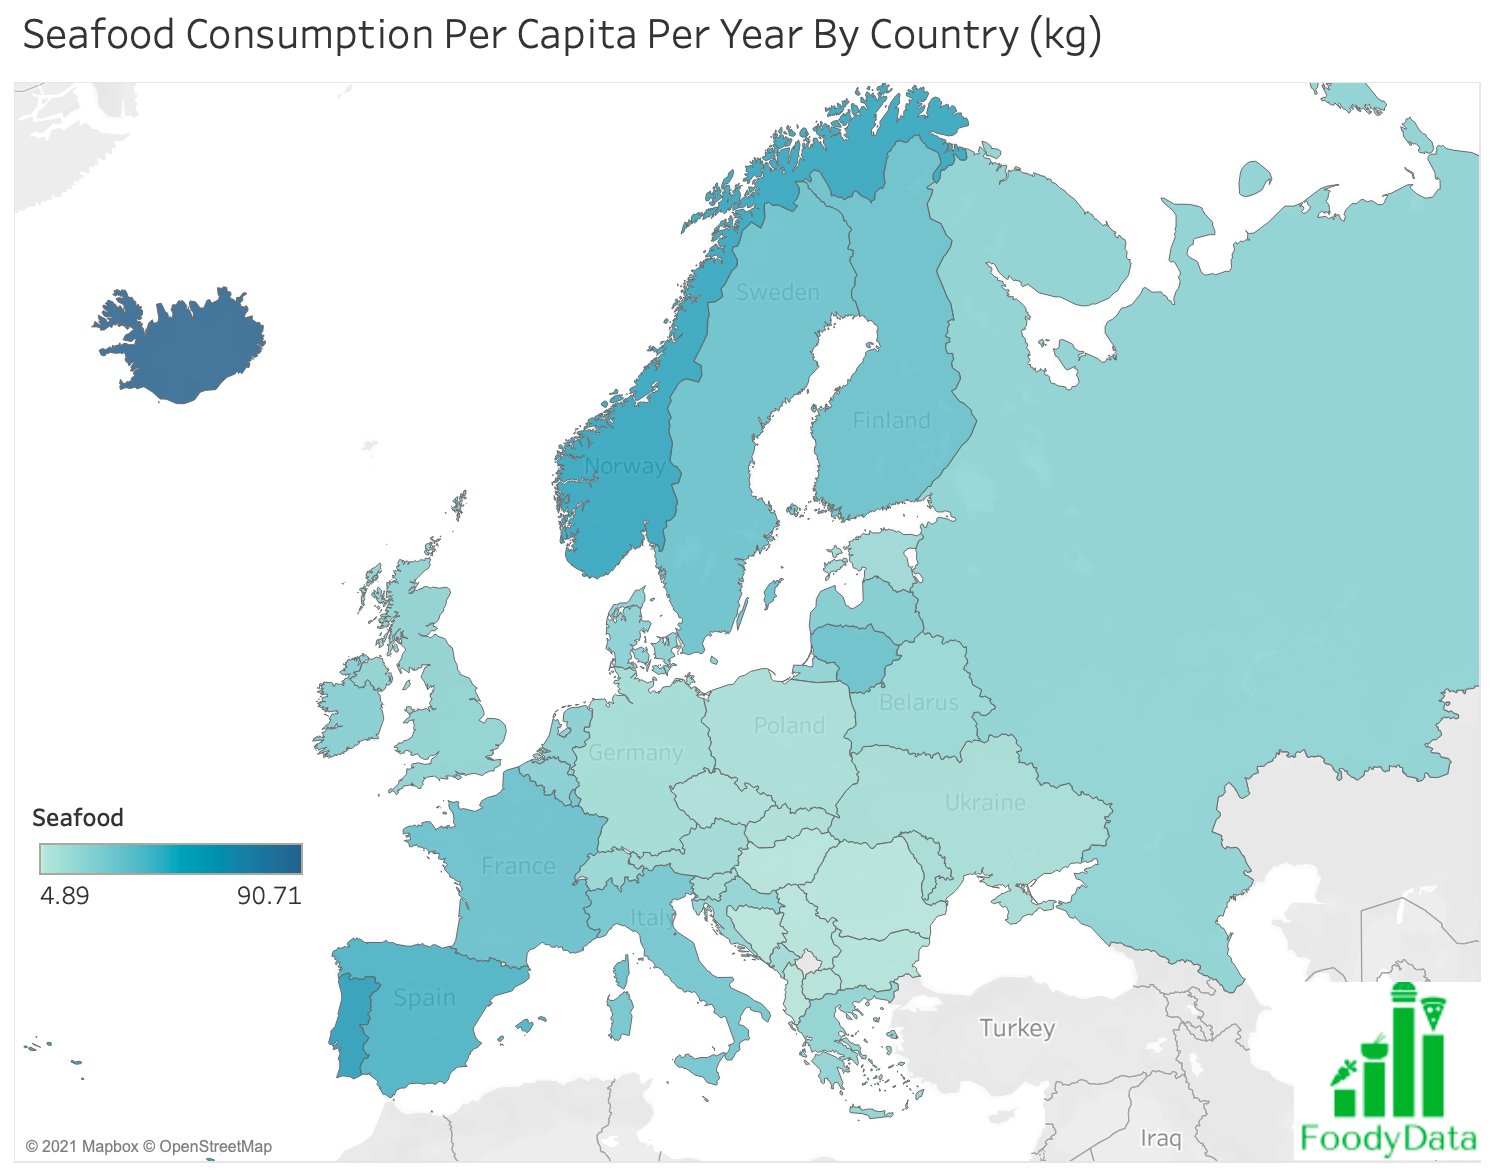
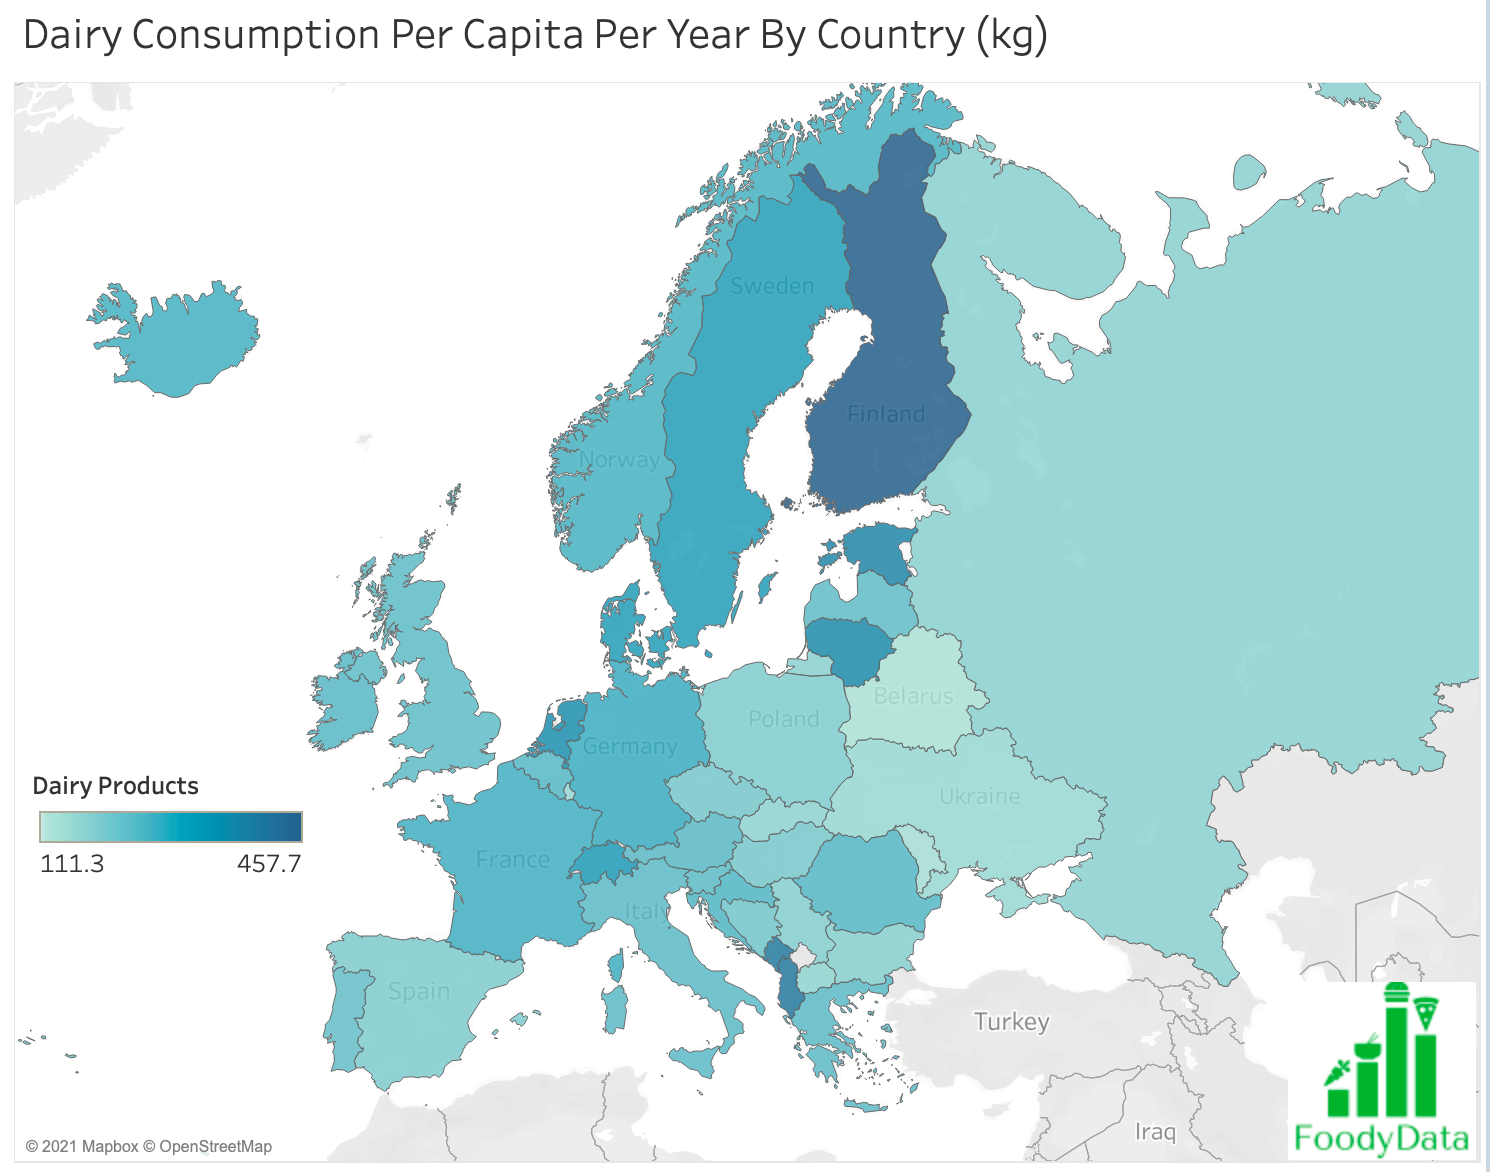
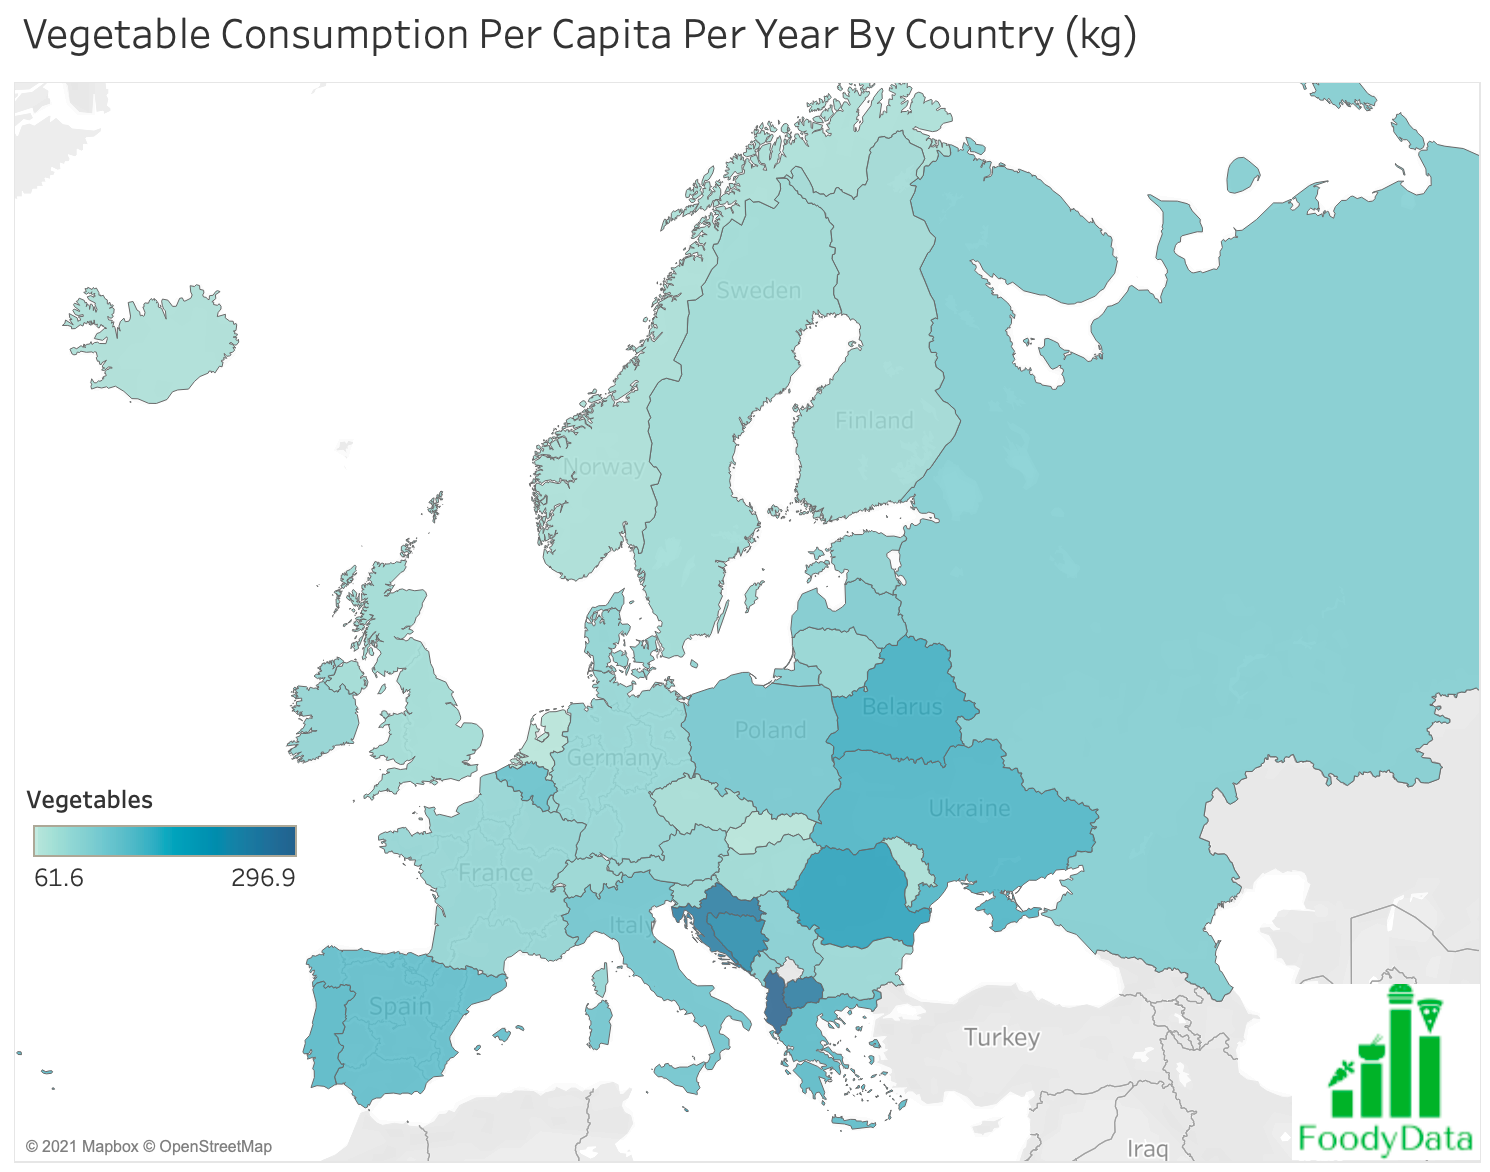
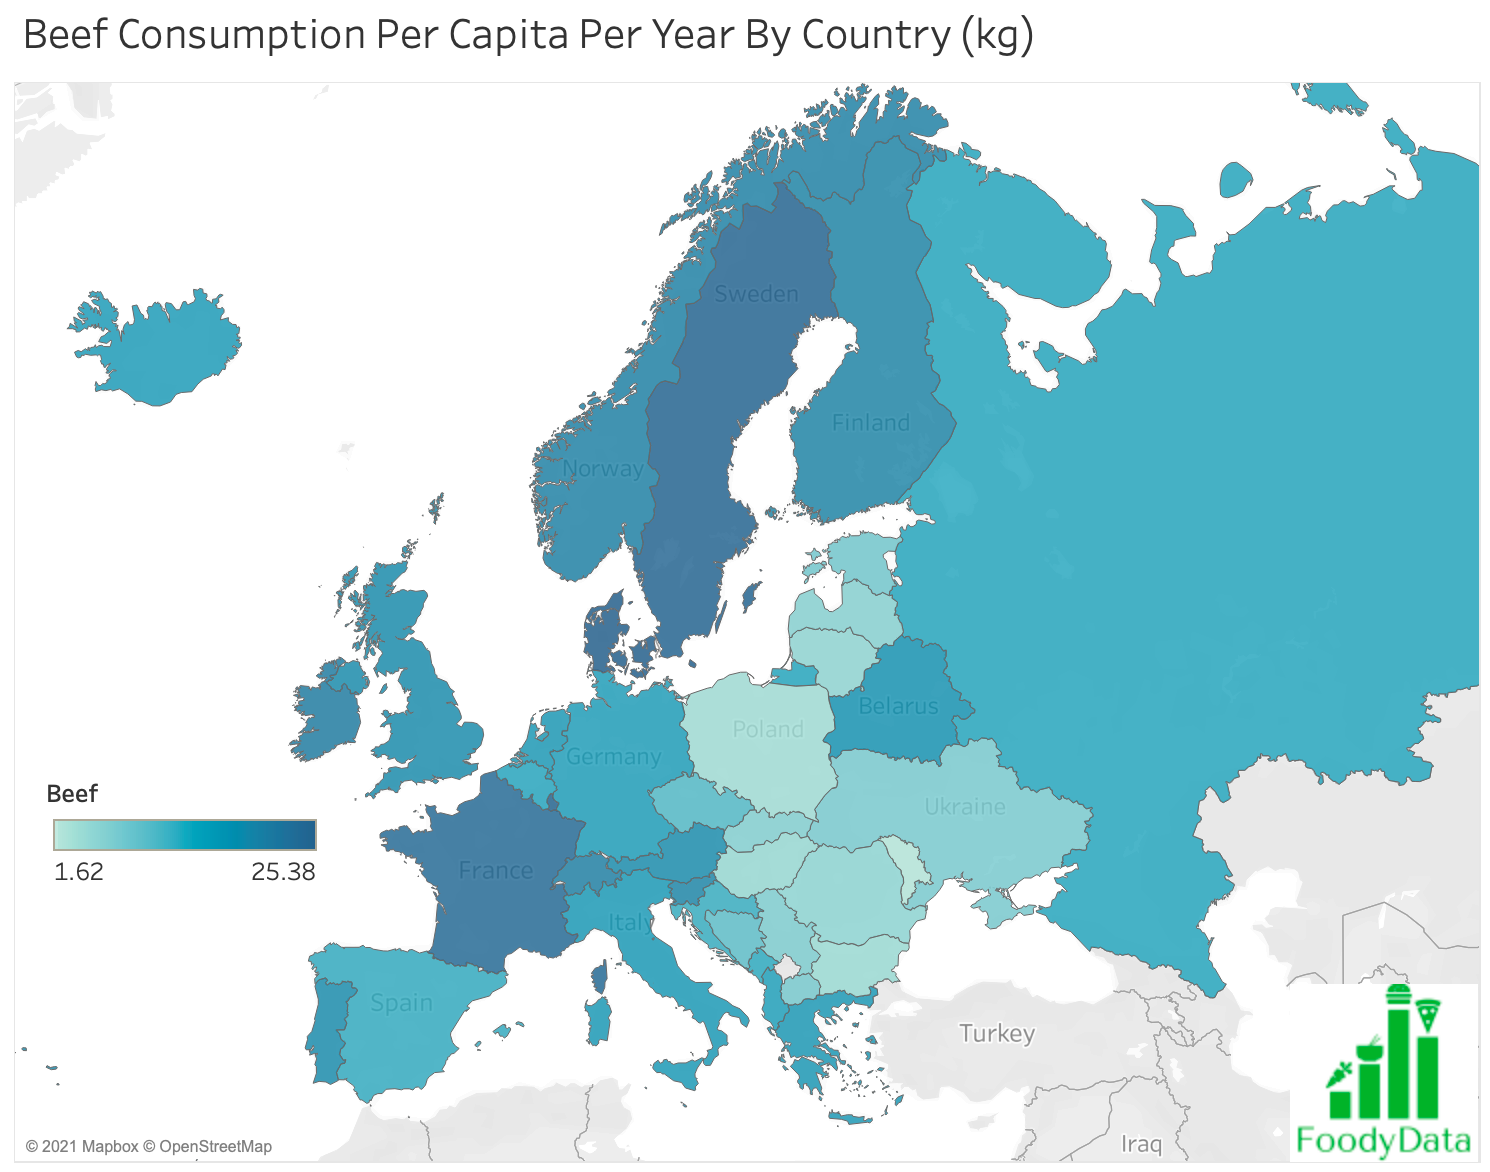
Below are a few maps of the individual consumption components.
6e7e38_3300560af4564010b8ab1b214cf45f09mv2-1001843 6e7e38_d1debf7b5d7a4bca8220ba08e6e03f78mv2-8185744 6e7e38_20b9647e723049f0a450bcb214f3acb2mv2-7169942 6e7e38_83a8f0fc2405468891f5272fd31f8652mv2-4147872 6e7e38_90bfcdd7ff9042d284aaef59890ba136mv2-8507072 6e7e38_13591ebb0dcf498a84888a1dde7f7c4bmv2-6012763

Source: https://ourworldindata.org

bottom of page

Shares: