top of page
Tom Tran
Updated: Oct 20, 2021
Visualizing regions of cuisines in America based on the distribution of restaurants’ cuisine
If you love eating out and are a fan of a certain cuisine like I am, say Thai food, you must have wondered where in America to get the most or the best Thai restaurants? What about Latin American food, Middle Eastern food and others? I love those, too. The question becomes can we describe America’s food scene regionally?
America is so large, so diverse and so regionally different that creating a map to describe what Americans eat anywhere in the country and how they differ from each other is a daunting task. It requires collecting a lot of data and a machine learning solution. Fortunately, I have done those and feel ready to tackle this.
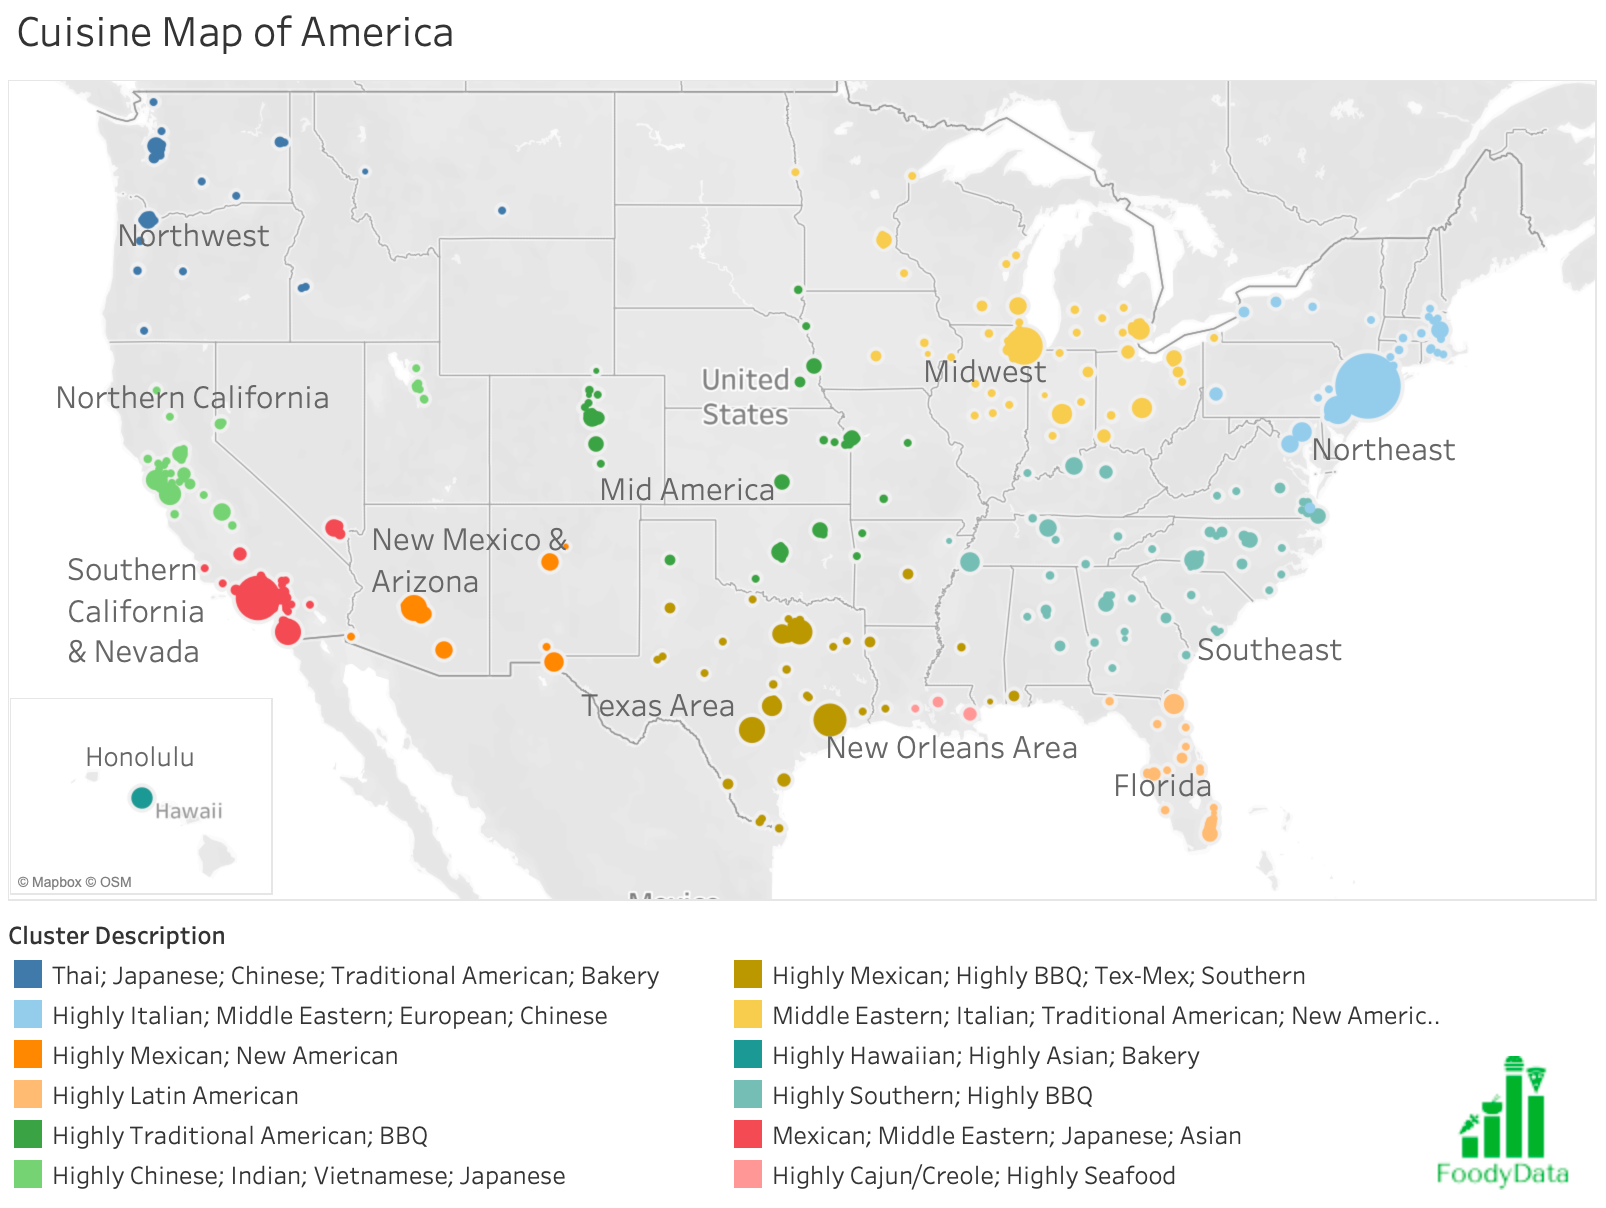
I obtained cuisine labels of restaurants from the largest 500 cities in America and performed clustering analysis (K-Means) on the features consisting of the cuisine types and the locations of them. The result is clusters of cities that are close to each other and have similar makeup of different cuisines.
Excluding Anchorage, Alaska due to being only one small city for a very large region, there are 12 clusters: Northwest, Northern California, Southern California & Nevada, New Mexico & Arizona, Mid America, Midwest, Texas Area, New Orleans Area, Northeast, Southeast, Florida, and Hawaii.
Northwest: Thai, Japanese, Chinese, Traditional American, Bakery
Northern California: Highly Chinese, Indian, Vietnamese, Japanese
Southern California & Nevada: Mexican, Middle Eastern, Japanese, Asian
New Mexico & Arizona: Highly Mexican, New American
Mid America: Highly Traditional American, BBQ
Midwest: Middle Eastern, Italian, Traditional American, New American
Texas Area: Highly Mexican, Highly BBQ, Highly Tex-Mex, Southern
New Orleans Area: Highly Cajun/Creole, Highly Seafood
Northeast: Highly Italian, Middle Eastern, European, Chinese
Southeast: Highly Southern, Highly BBQ
Florida: Highly Latin American
Hawaii: Highly Hawaiian, Highly Asian, Bakery
The term “highly” means having very high (usually highest) proportion out of total number of restaurants for that city/cluster compared to other clusters. The description indicates the most striking characteristics, but not the comprehensive description of a cluster. For example, the Southeast area is also high on Traditional American.
The names of the clusters are also not comprehensive. For instance, Arizona & New Mexico cluster also contains El Paso, TX.
This map is explained by the ethnic populations around America and culture influence they created. For example, there is a significant Hispanic population in Florida that created the highly Latin American cuisine culture.
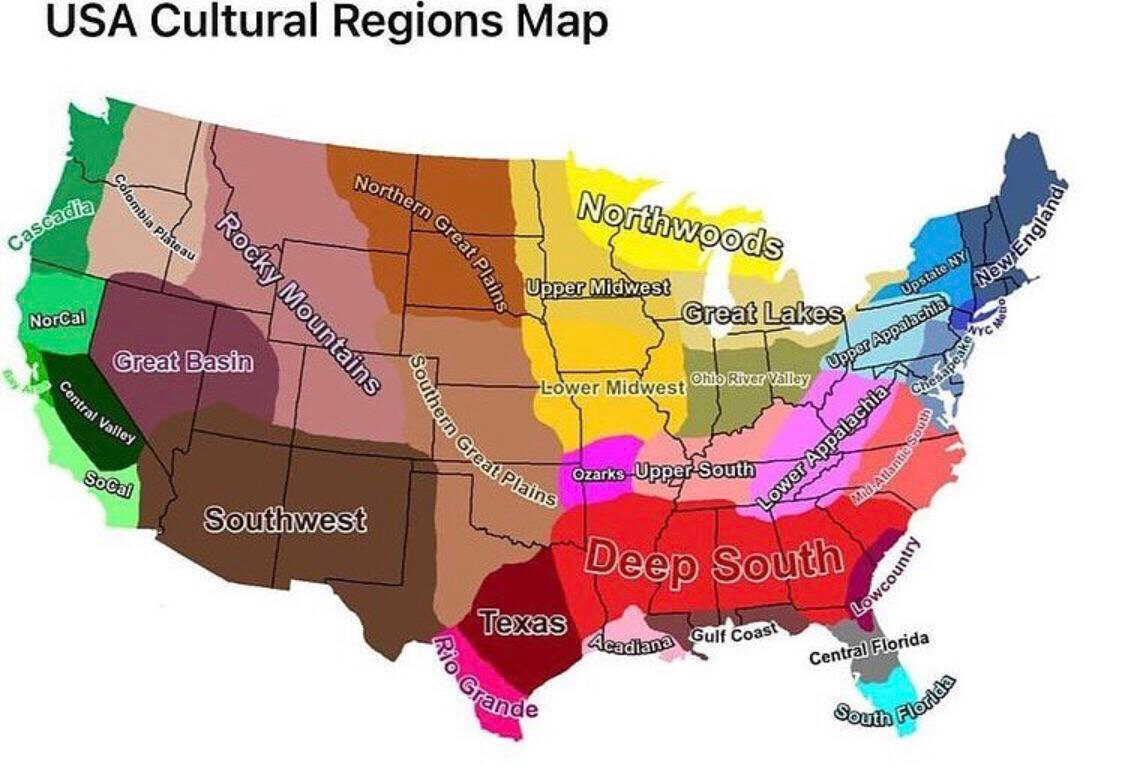
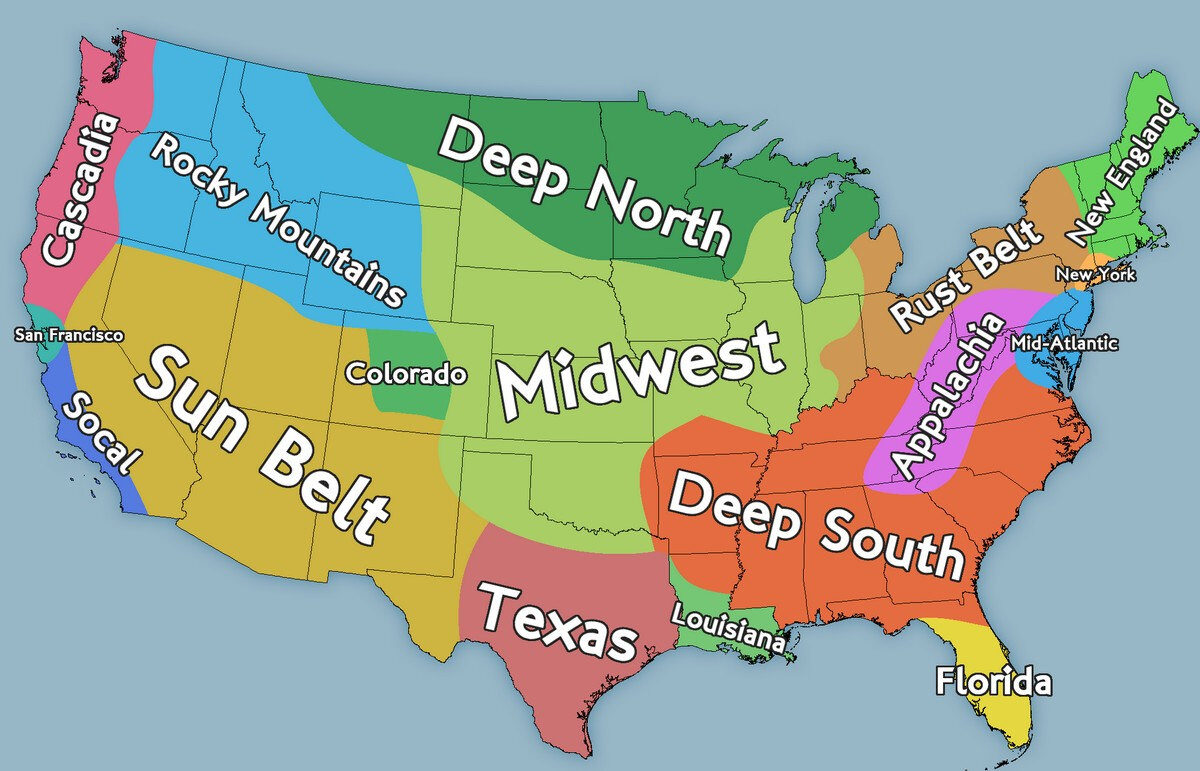
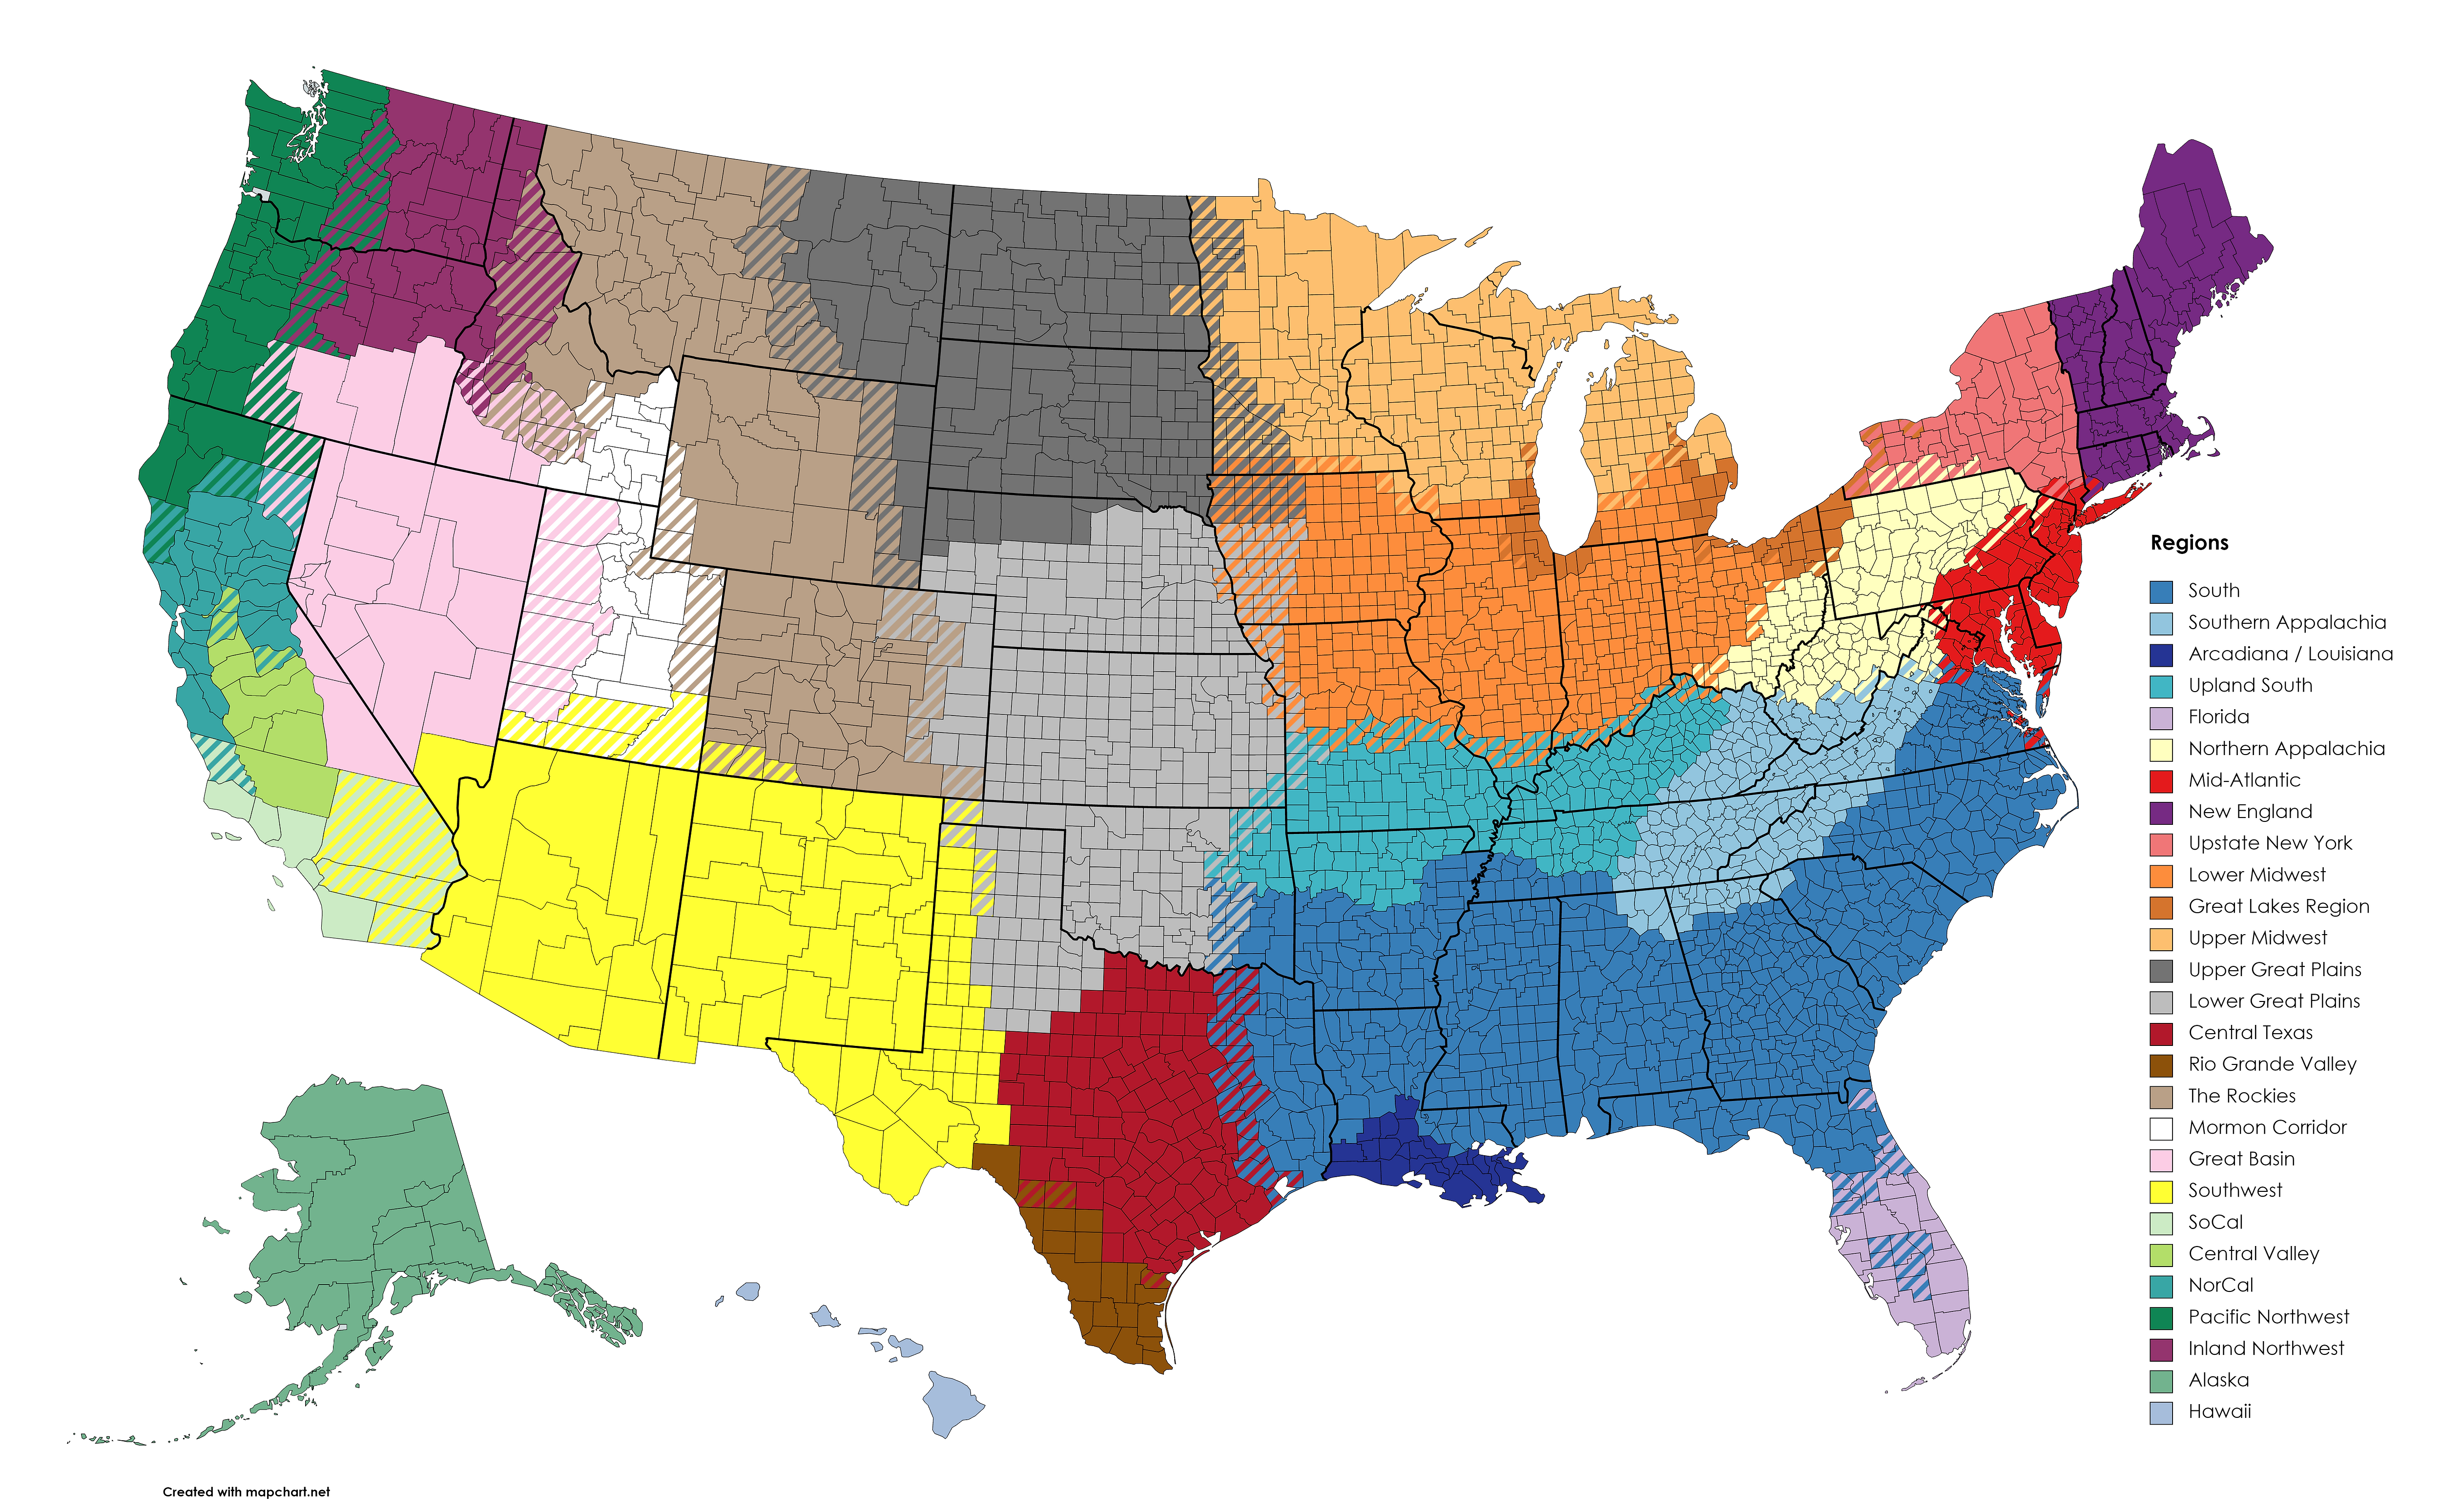
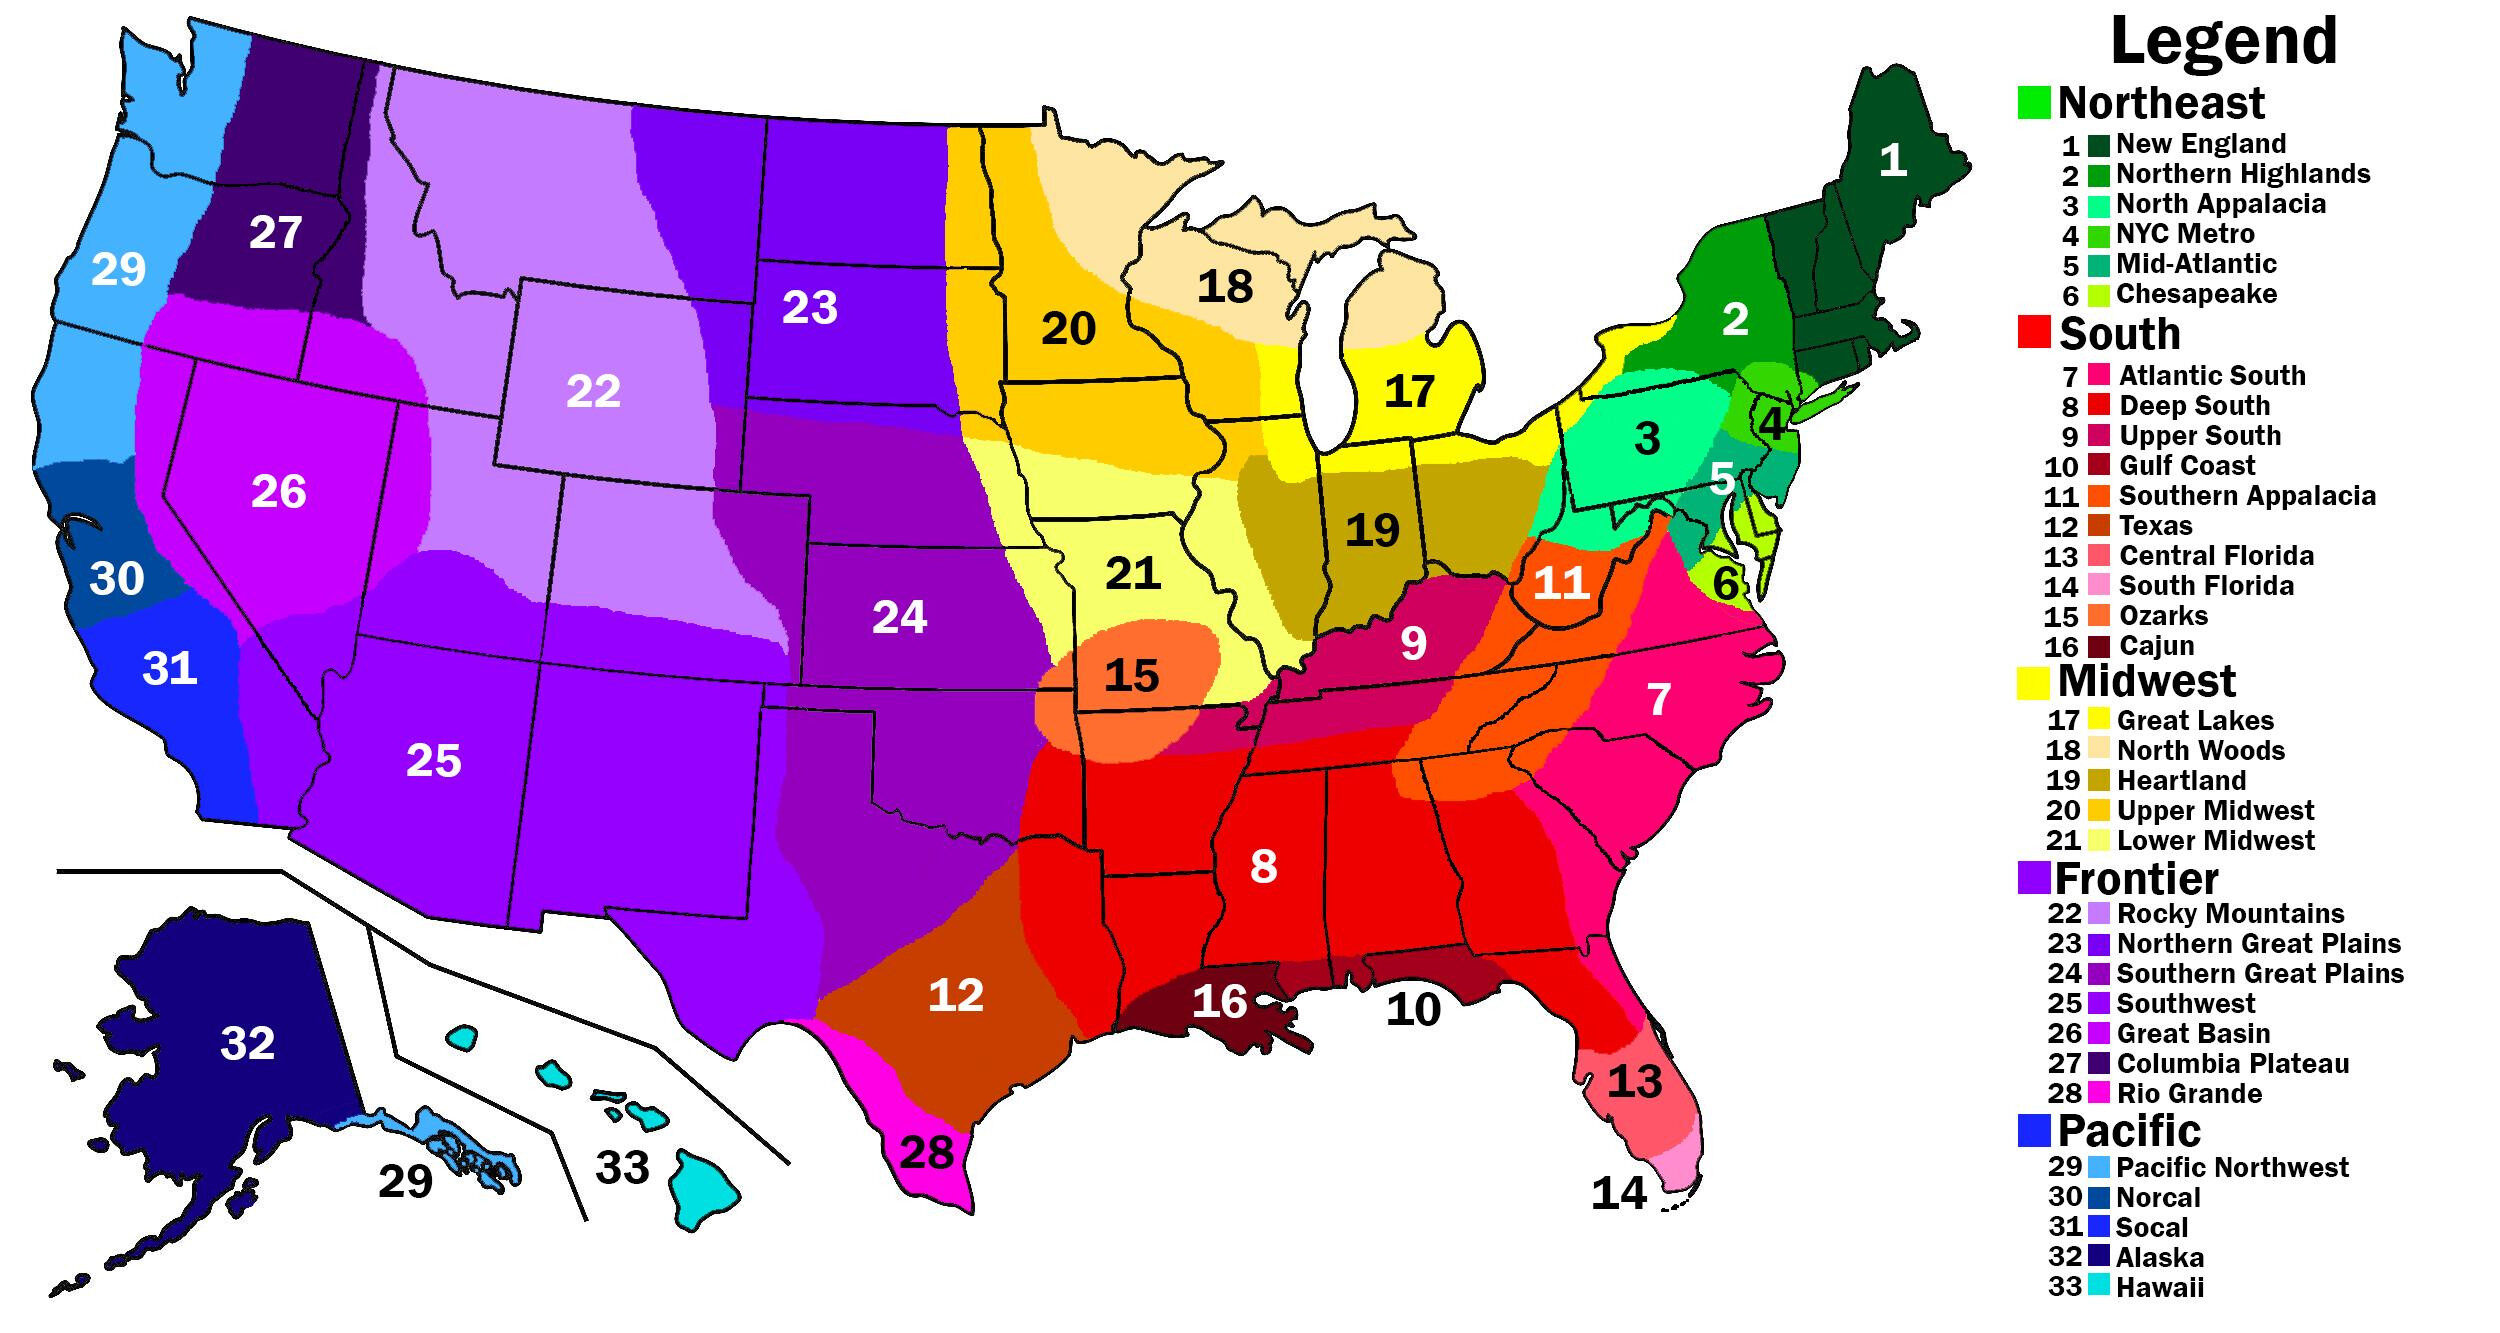
I also found a couple of culture maps that are all different in certain ways, but generally corroborate our cuisine map.
Italian = Pizza, Pasta Shops, Italian, etc.
Middle Eastern = Turkish, Mediterranean, Lebanese, etc.
Indian = Indian, Pakistani, etc.
Chinese = Chinese, Cantonese, Taiwanese, etc.
Japanese = Japanese, Sushi, Ramen, etc.
Asian = Asian Fusion, Chinese, Vietnamese, etc.
Traditional American = Burgers, Sandwiches, Hot Dogs, Diners, Steakhouses, etc.
I also produced a generalized state level cuisine map. Notice the shade difference for bordering states of two clusters like Idaho, Montana, Wyoming, Dakotas and Mississippi indicating the transition and lower intensity.
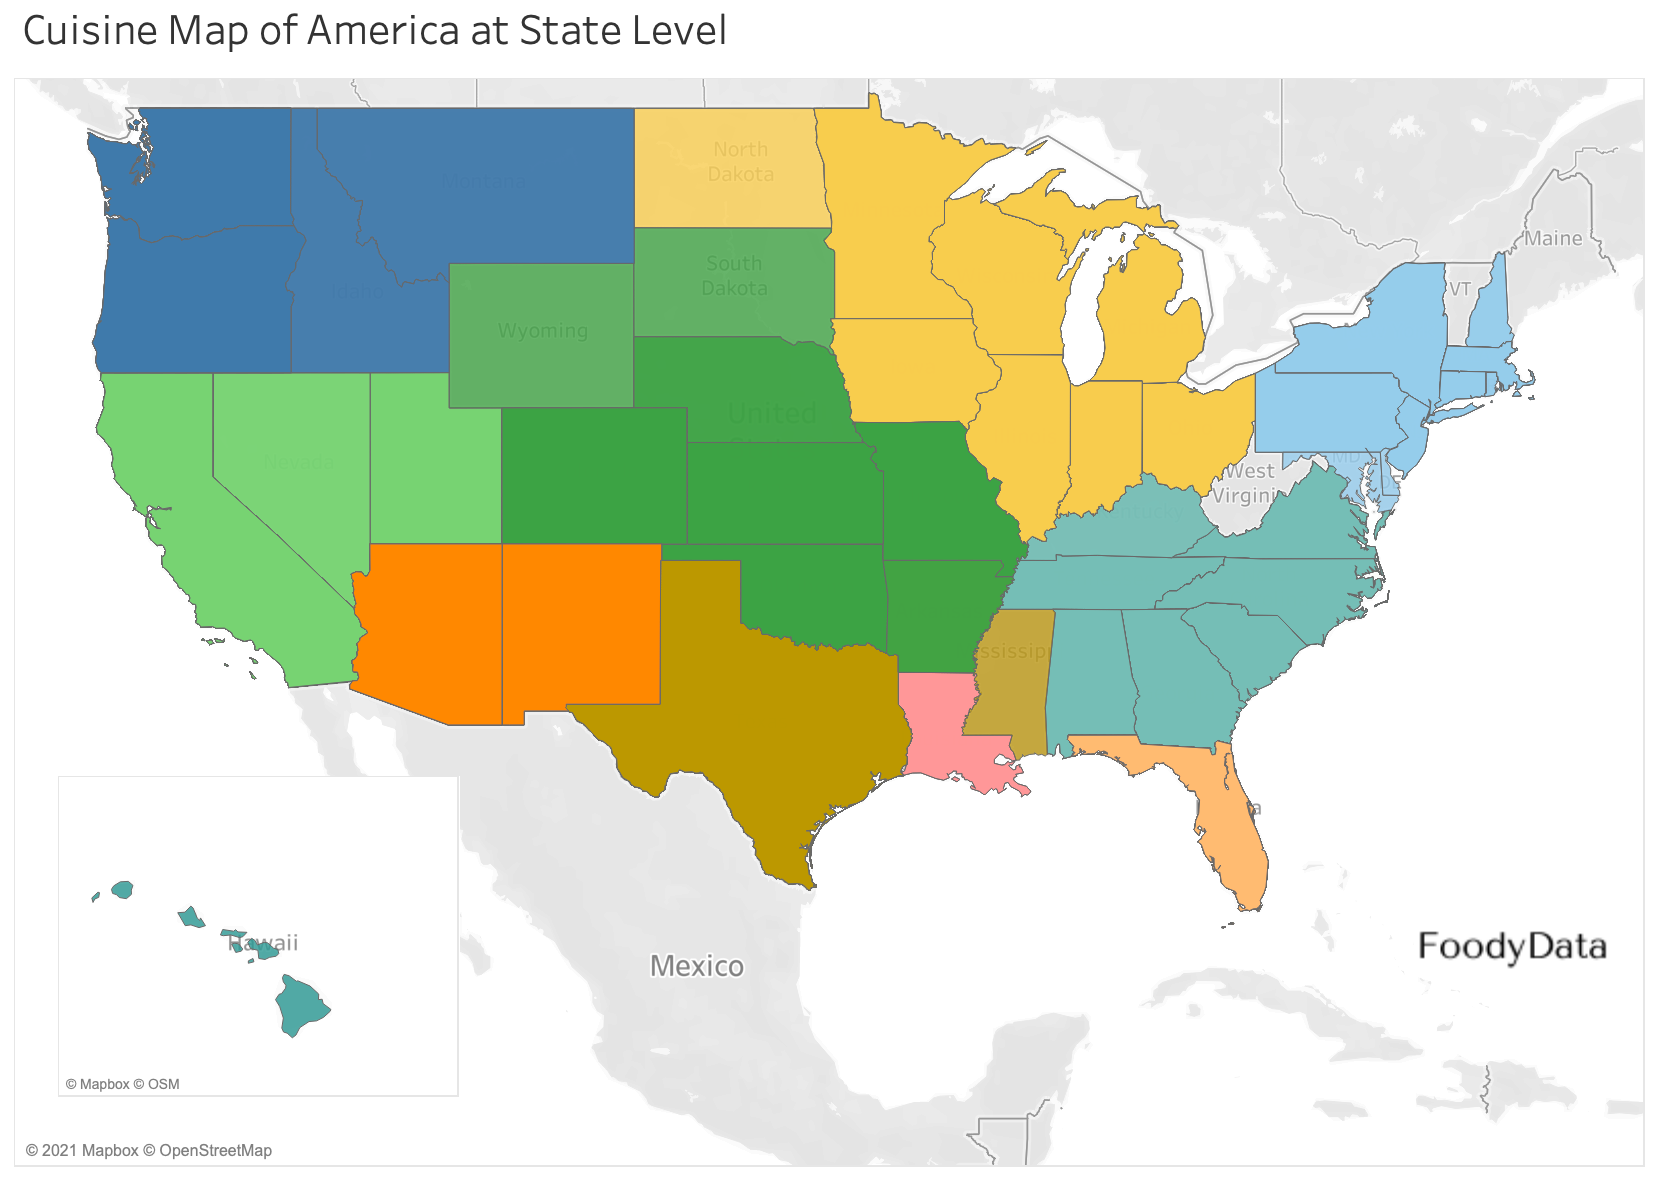
Mississippi is an interesting instance since its core in Southern food is influenced by Texas and Louisiana cuisines creating a mix at the state level.
West Virginia, Vermont and Maine do not have any city in the largest 500 list, so they’re not assigned a cluster. However, we can project that Vermont and Maine are Northeast (obviously) and West Virginia is Southeast (from search results).
The final projected and generalized Cuisine Map at State Level looks like this:
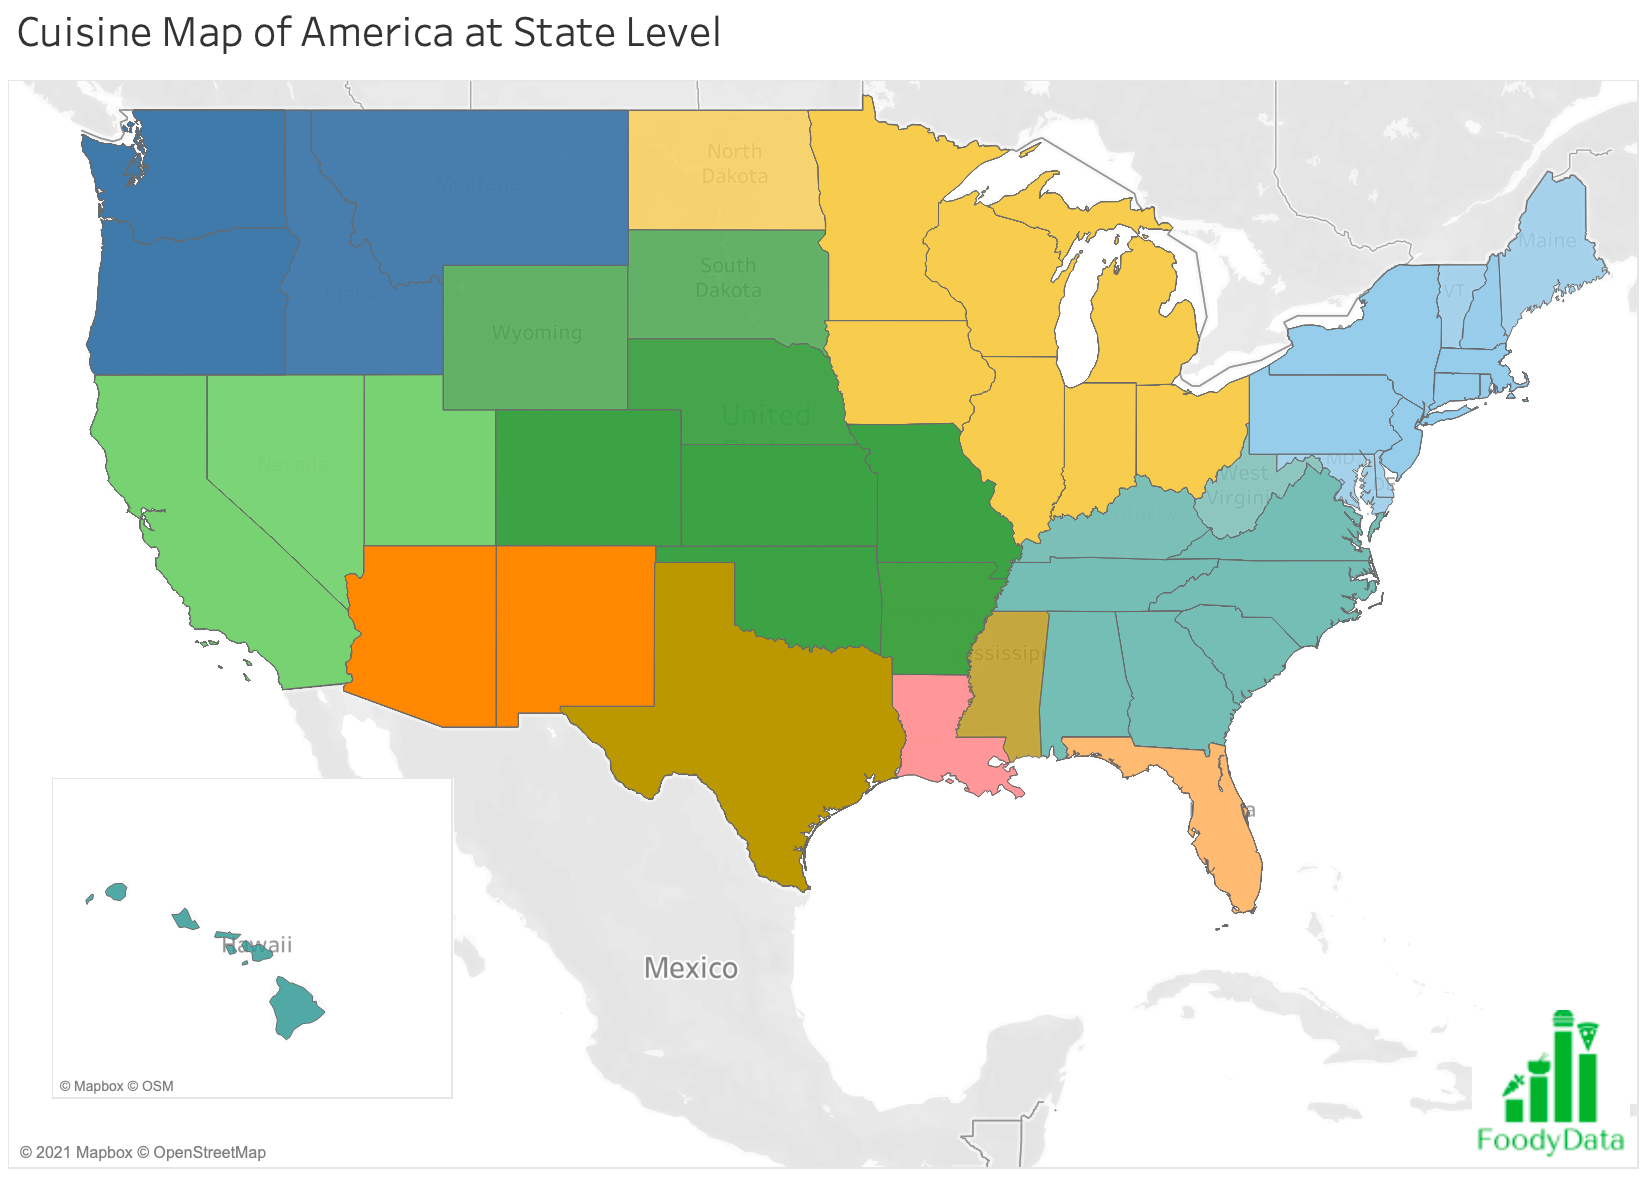
Source: openstreetmap, K-means.
bottom of page